The Asian Americans and Pacific Islanders (AAPI) Houston Residential Map

Winter 2022

Anne Chao asked the GIS/Data Center to create a map showing the residential distribution of the Asian Americans and Pacific Islanders (AAPI) community in greater Houston using data from the American Community Survey.

Map created by Max Chong


Posted in Uncategorized | Leave a comment

Disaster Risk and Exposure: Examining Natech Hazards and Regional Protection for Galveston County

Summer 2022

As part of the Gulf Scholars Program: Gulf Impact Project, this team of students examined Natural Hazards at Hazardous Installations (Natech) by mapping Aboveground Storage Tanks (ASTs) in Galveston County. They then used these maps and other data to create a variety of reference maps to set the scene and analytical maps showing expected spill volume of these storage tanks.

Thematic reference maps:

  • Aboveground Storage Tanks (ASTs) in Galveston County with redlining data from Mapping Inequality, splitting Galveston City into “Best,” “Still Desirable,” “Definitely Declining,” and “Hazardous” regions.
  • CDC/ATSDR Social Vulnerability Index (SVI) in Galveston County
  • Natech Risk and Exposure Index (NREI) in Galveston County
  • The CDC/ATSDR Social Vulnerability Index (SVI) and the Natech Risk and Exposure Index (NREI) in Galveston County.

Analytical thematic maps: (please note the all spill volumes are preliminary)

  • Volume of chemicals expected to spill from failed ASTs in FEMA36 conditions without any regional protection strategies in Galveston County.
  • Volume of chemicals expected to spill around Texas City from failed ASTs in FEMA36 conditions without any regional
    protection strategies in Galveston County.
  • Expected spill volume (without a regional protection system) due to a FEMA36 event with a bivariate plot of the CDC/ATSDR Social Vulnerability Index (SVI) and the Natech Risk and Exposure Index (NREI) in Galveston County.
  • Expected spill volume (without a regional protection system) due to a FEMA36 event with Latine population as reported in census data.


More information on the Gulf Scholars Program can be found at https://engineering.rice.edu/gsp

* information provided by Valentina Osorio

Posted in Uncategorized | Leave a comment

Use of Professional Sports Stadiums as Polling Locations

Spring 2022

Rice affiliates Mason Reece and Bob Stein worked as part of a multi-university team  identifying where (ie the physical polling location) that people cast their ballots, if they voted in-person. They were particularly interested in studying the use of professional sports stadiums as polling locations, since this was a mostly new thing in 2020 and at least anecdotally they were very popular and well-run. Among the projects larger goals and data collection efforts, they used administrative voter files containing information on where each voter in a county cast their ballot in 2020.

They geocoded each of the voters in those county datasets and created some simple exploratory maps for the team to peruse, and which will most likely be part of their final report shared with the stakeholders invested in the project. Maps attached are for Washington DC and for Mecklenburg County, NC. There are markers for each of the stadiums used as polling places in the county, and blue voters are people who voted at the stadium, whereas red voters voted at some other type of polling location. They’ve used what is effectively kernel density in ArcGIS to achieve this, thus the varying opacities. In addition there is an alternative map for DC, which uses shades of blue to identify overall voter turnout in that precinct, and then uses a dot of varying size to show how many voters in that precinct cast their ballot at a stadium.

One of the main uses of ArcGIS was using the Network Analyst feature to calculate drive-times and geodesic distances between voters and each of the stadiums. There really isn’t a great way to visualize this but they have been making great use of the feature.

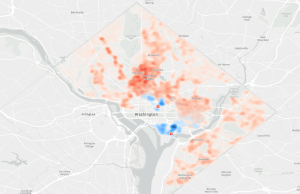
Density Map: Washington, DC


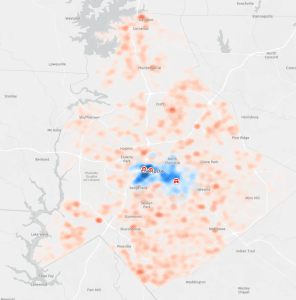
Density Map: Mecklenburg County, NC


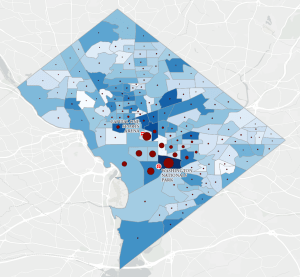
Voter Turnout Map: DC Precinct Level


* information provided by Mason Reece

Posted in Uncategorized | 1 Comment